Redicom Analytics
| Use to view more |
|---|
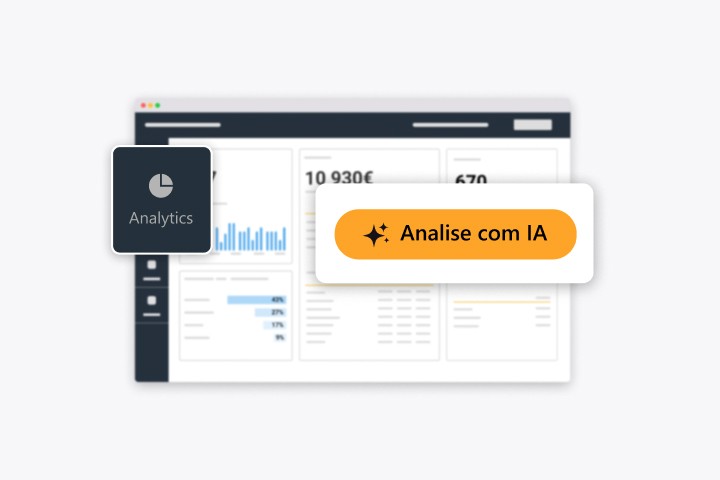
  100% integrated |
| Use to view more |
|---|
 No complex implementations |
| Use to view more |
|---|
 Real-time data |
| Use to view more |
|---|
 Optimized reports |
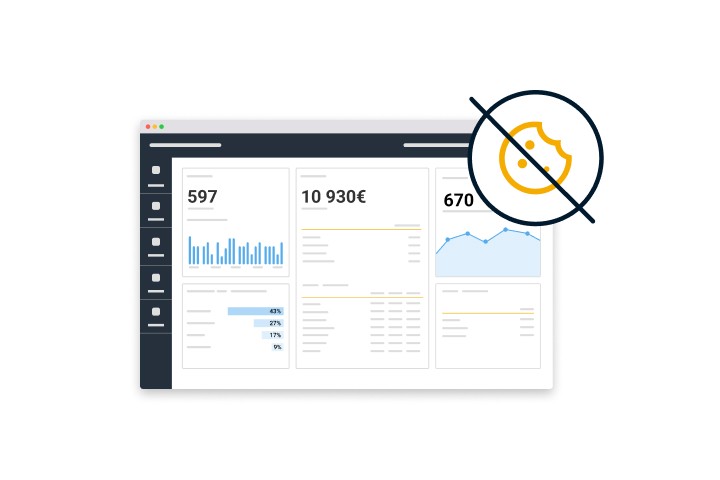
| Use to find out how users find you! |
|---|
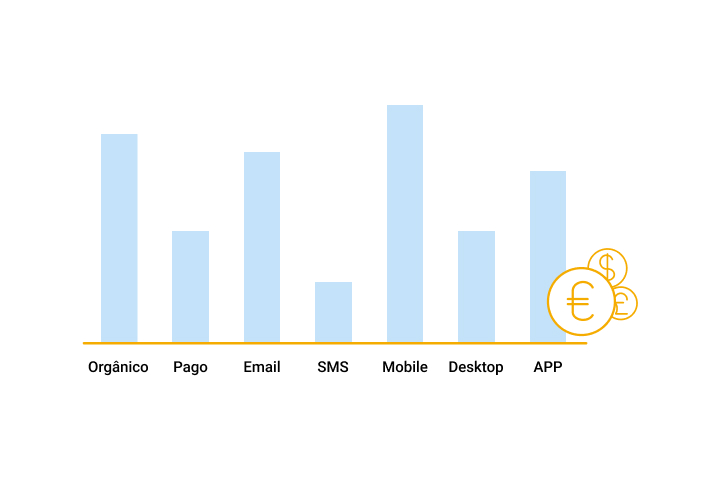
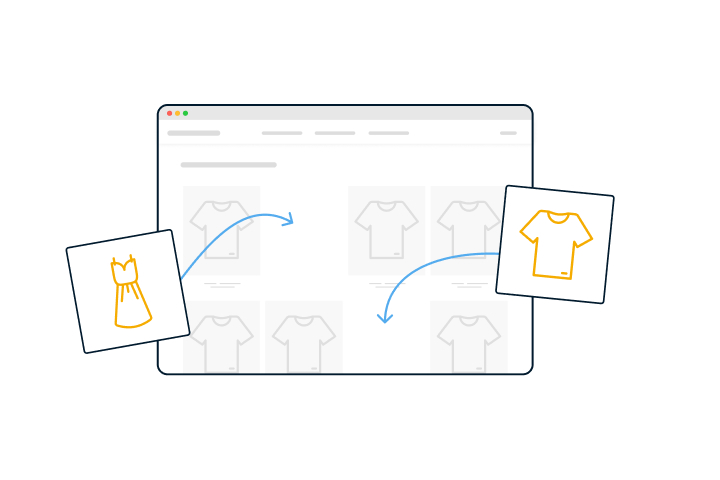
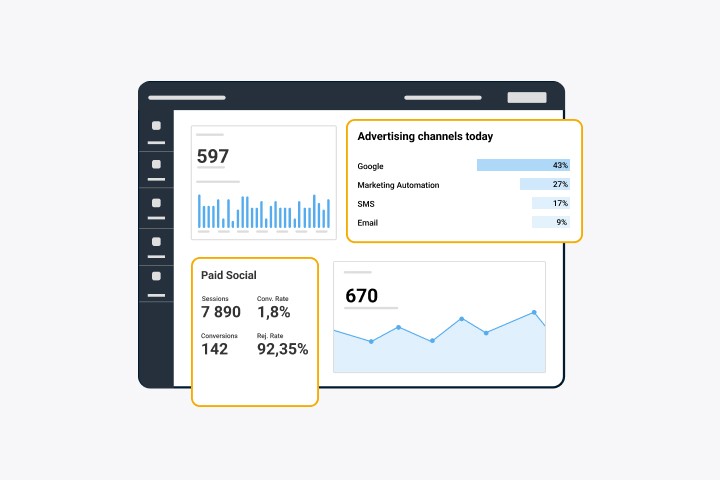
 Find out how users find you!The Traffic Acquisition report allows you to analyze the origin of website visits, providing essential data on the performance of different acquisition channels: organic search, paid ads, social media, email, among others. This analysis helps you understand which channels generate the most traffic, engagement and conversions, allowing you to optimize marketing strategies based on real data. |
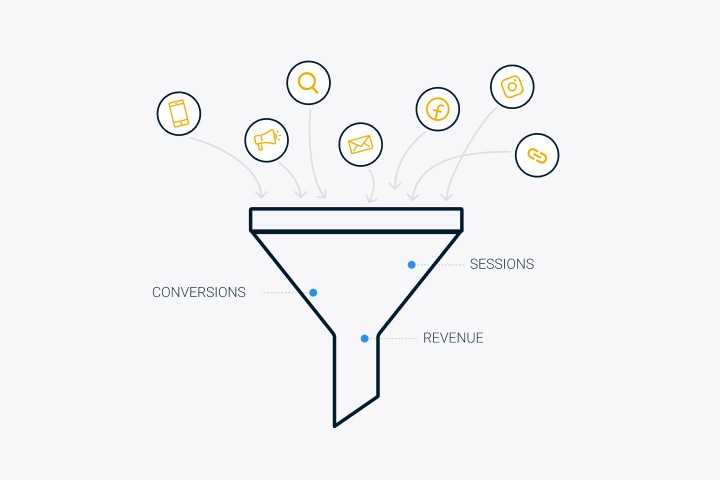
| Use to measure the real impact of each advertising channel |
|---|
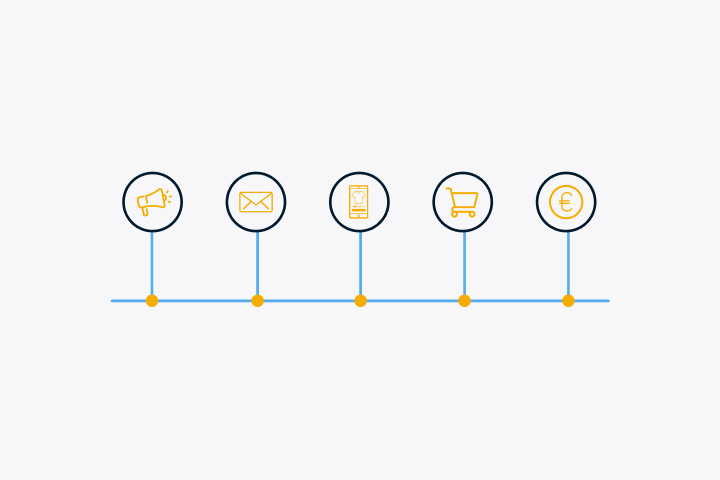
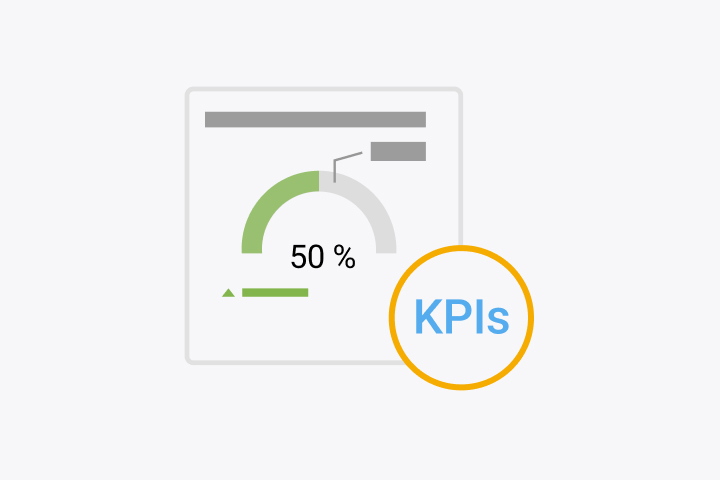
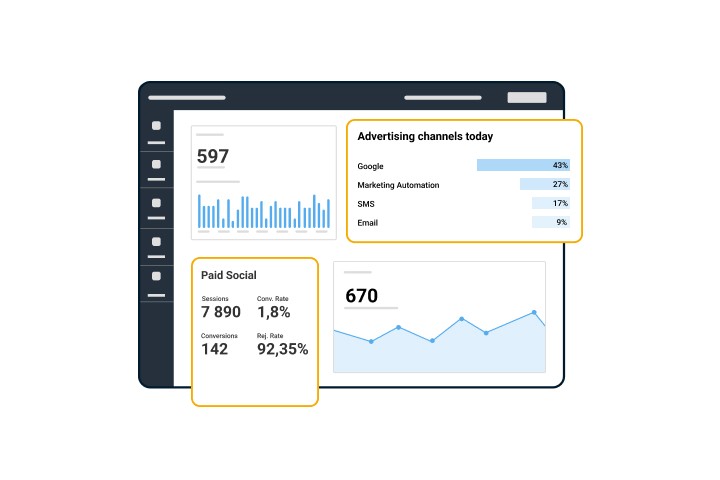 Measure the real impact of each advertising channelKnow exactly the real impact of each advertising channel on traffic and conversions. Analyze the performance of advertising channels and assess where there is the greatest return. This analysis is essential for optimizing investments and understanding which channels bring in more qualified visitors and effective results. |
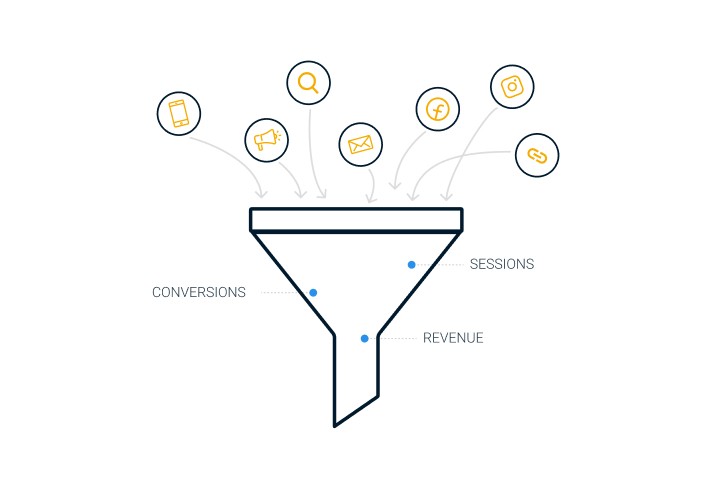
| Use to track sales by channel and device |
|---|
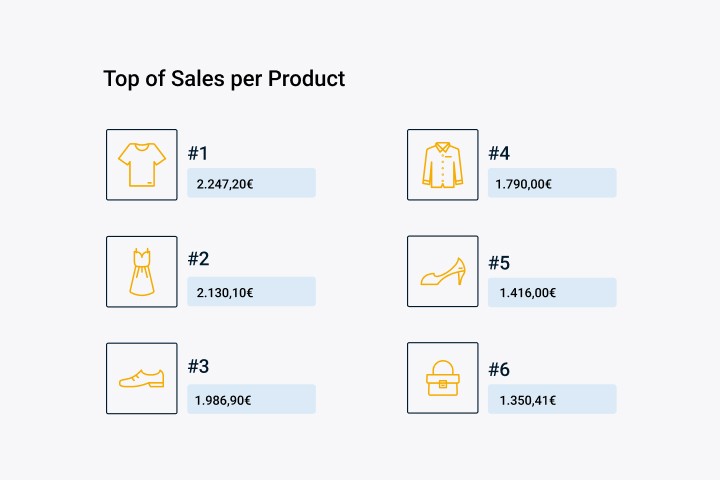
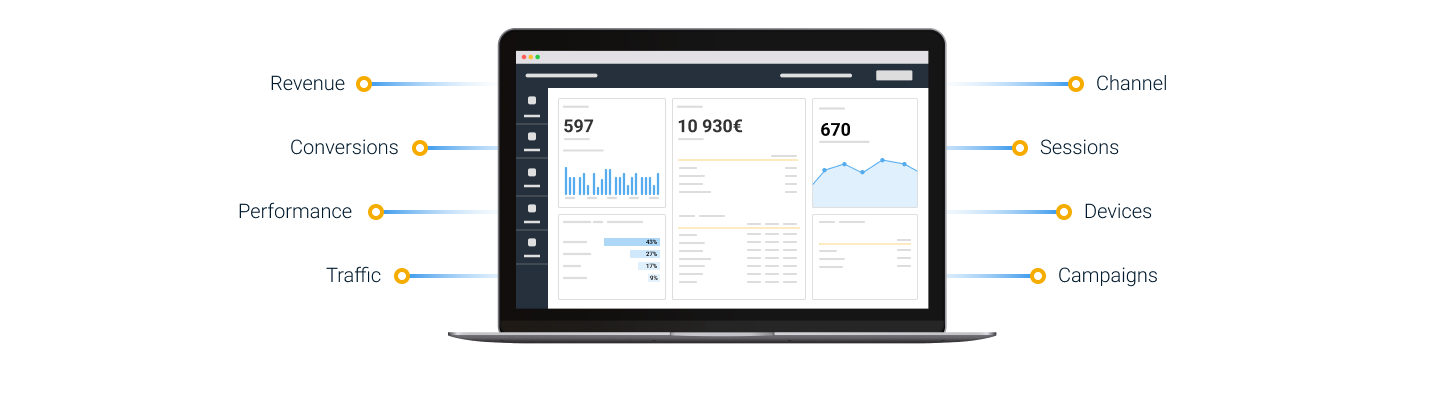
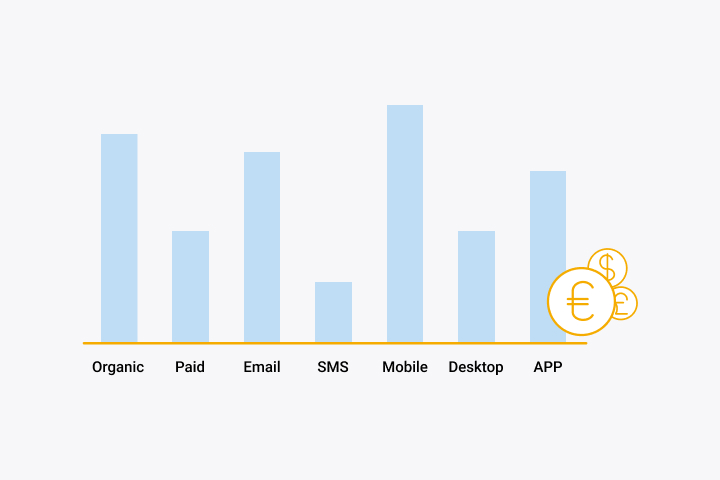 Track sales by channel and deviceThe Daily Revenue Analysis report provides a detailed overview of sales, allowing you to track total revenue and traffic distribution by channel and device. With this analysis, you can identify trends, assess the impact of different traffic sources, optimize promotional actions and improve the user experience. |